Benchmarks · Frontier vs the pack · August 2026
The Frontier's Lead Lives on the Hard Tests
Anthropic and OpenAI against every other lab, best model each, benchmark by benchmark, since January 2025. The pack has closed the gap almost everywhere: a 13.9-point median deficit then is 1.0 today. On the hardest tests it has widened, from 6.6 to 11.8 on the same benchmarks. The frontier's lead now lives on the hard tests, and only there.
Two sides. The frontier: every model from Anthropic or OpenAI. The pack: every model from every other lab. On each benchmark, each side is its single best score: best model, best configuration, any release date. A lab's older flagship counts if it still scores highest. Same rule on both sides. Eight questions, eight charts.
01
Has the frontier's lead grown or shrunk?
Both. On the 67 benchmarks scored on both sides in January 2025, the pack's median deficit was 13.9 points; on those same benchmarks it is 1.0 today, and on the easy ones (SDI 135 and below) it flipped to a 0.7-point pack lead. On the 10 hardest of them (SDI above 155) the deficit went the other way, 6.6 to 11.8. Since October 2025 the overall median has been flat (1.5 then, 1.4 now) while the hard band on the same 19 benchmarks went from 2.1 to 9.0. Watch the wake: the line settles onto zero from the left and pulls away from it on the right.
Frame by frame: through 2025 the hard band rests on 10 to 20 benchmarks and swings with each launch: 14 points to the frontier in April, a 4-point pack lead for a few weeks in August. From autumn 2025 the band fills in and the line heads one way: 2 points to the frontier in September, 7.6 in November, 11.5 by June 2026, then back to 7.4 in August as the new pack flagships land. The easy band sits within about a point of zero from mid-2025 on. Over 20 months the change is at the hard end, and only there.
Next: where the pack's best models sit today, and how far the frontier is.
02
How far is the best of the pack from the frontier?
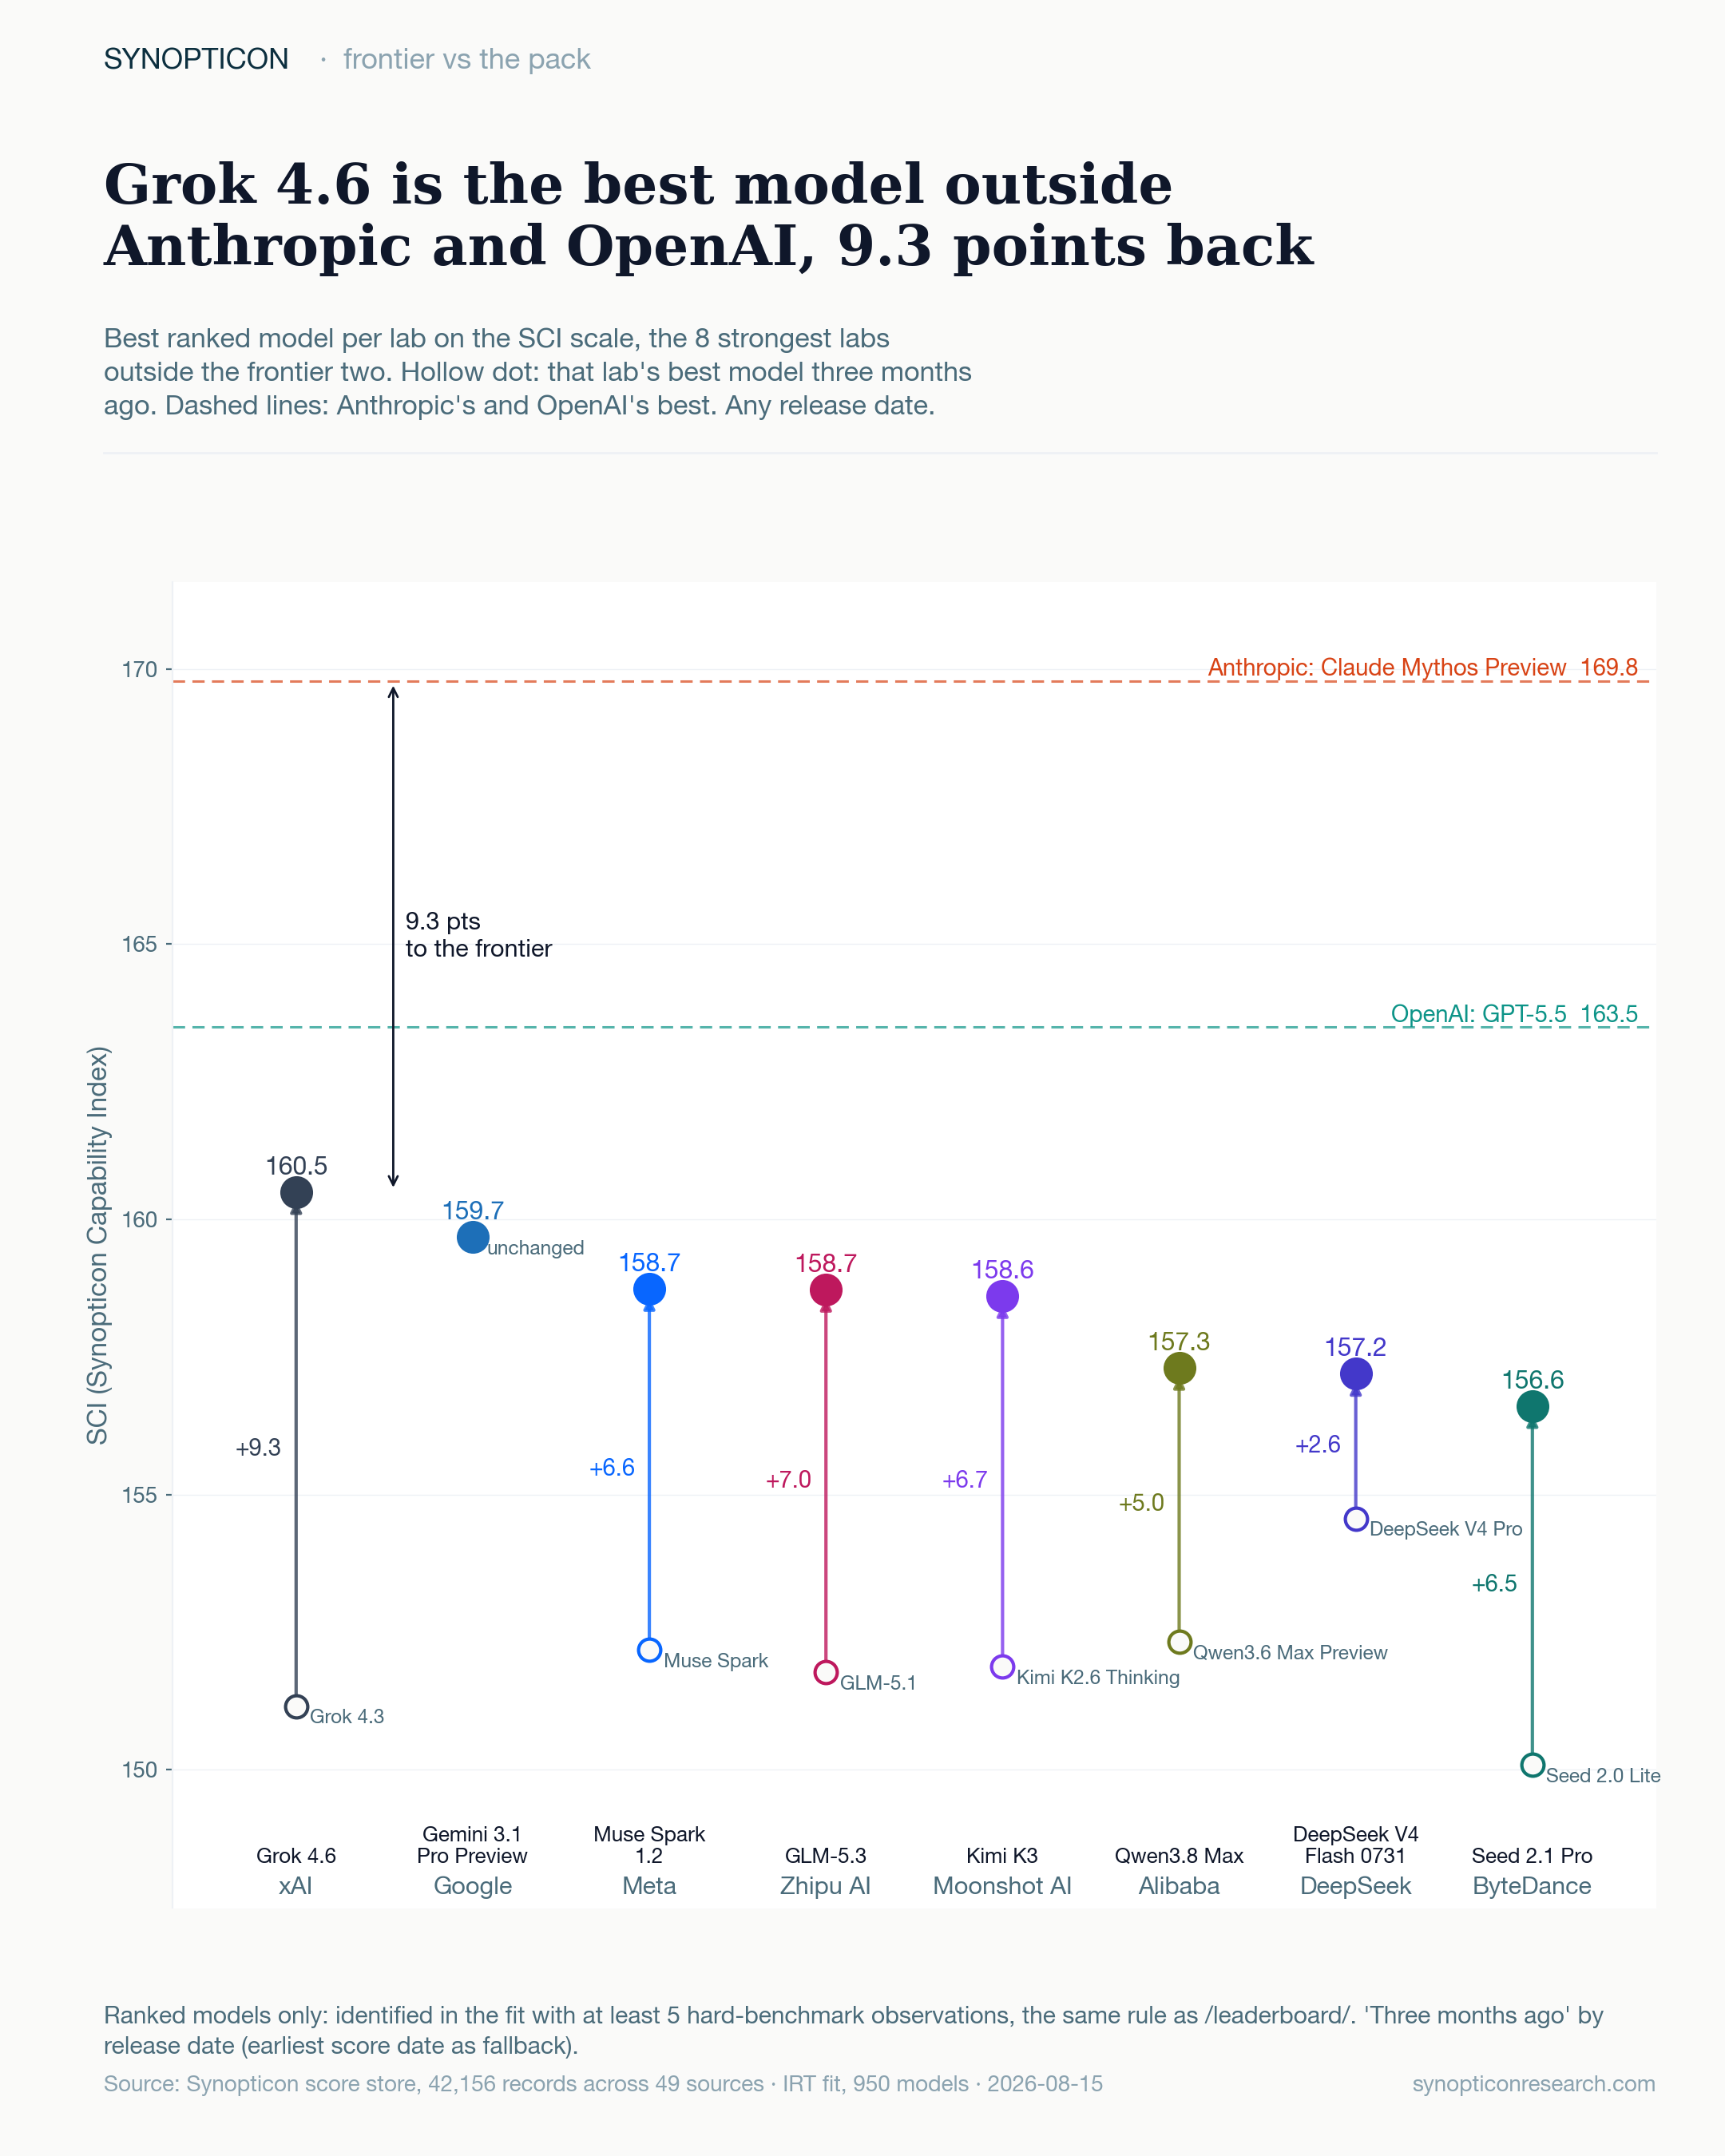
Grok 4.6 at 160.5 is the best model outside the two frontier labs, 3.0 points behind OpenAI's best (GPT-5.5, 163.5) and 9.3 behind Anthropic's (Claude Mythos Preview, 169.8; a preview, restricted access). Behind it the pack is tightly bunched: Gemini 3.1 Pro 159.7, Muse Spark 1.2 and GLM-5.3 at 158.7, Kimi K3 158.6, then Qwen3.8 Max, DeepSeek V4 Flash and Seed 2.1 Pro between 156.6 and 157.3. All eight sit within four points of each other. Two labs sit above all of them. The hollow dots are each lab's best model three months ago: seven of the eight moved up in that window, by 2.6 (DeepSeek) to 9.3 (xAI, Grok 4.3 to 4.6); Google's best is unchanged since Gemini 3.1 Pro.
Next: a single number hides where the gap sits. So look at the benchmarks people quote.
03
On the marquee benchmarks, is the pack level?
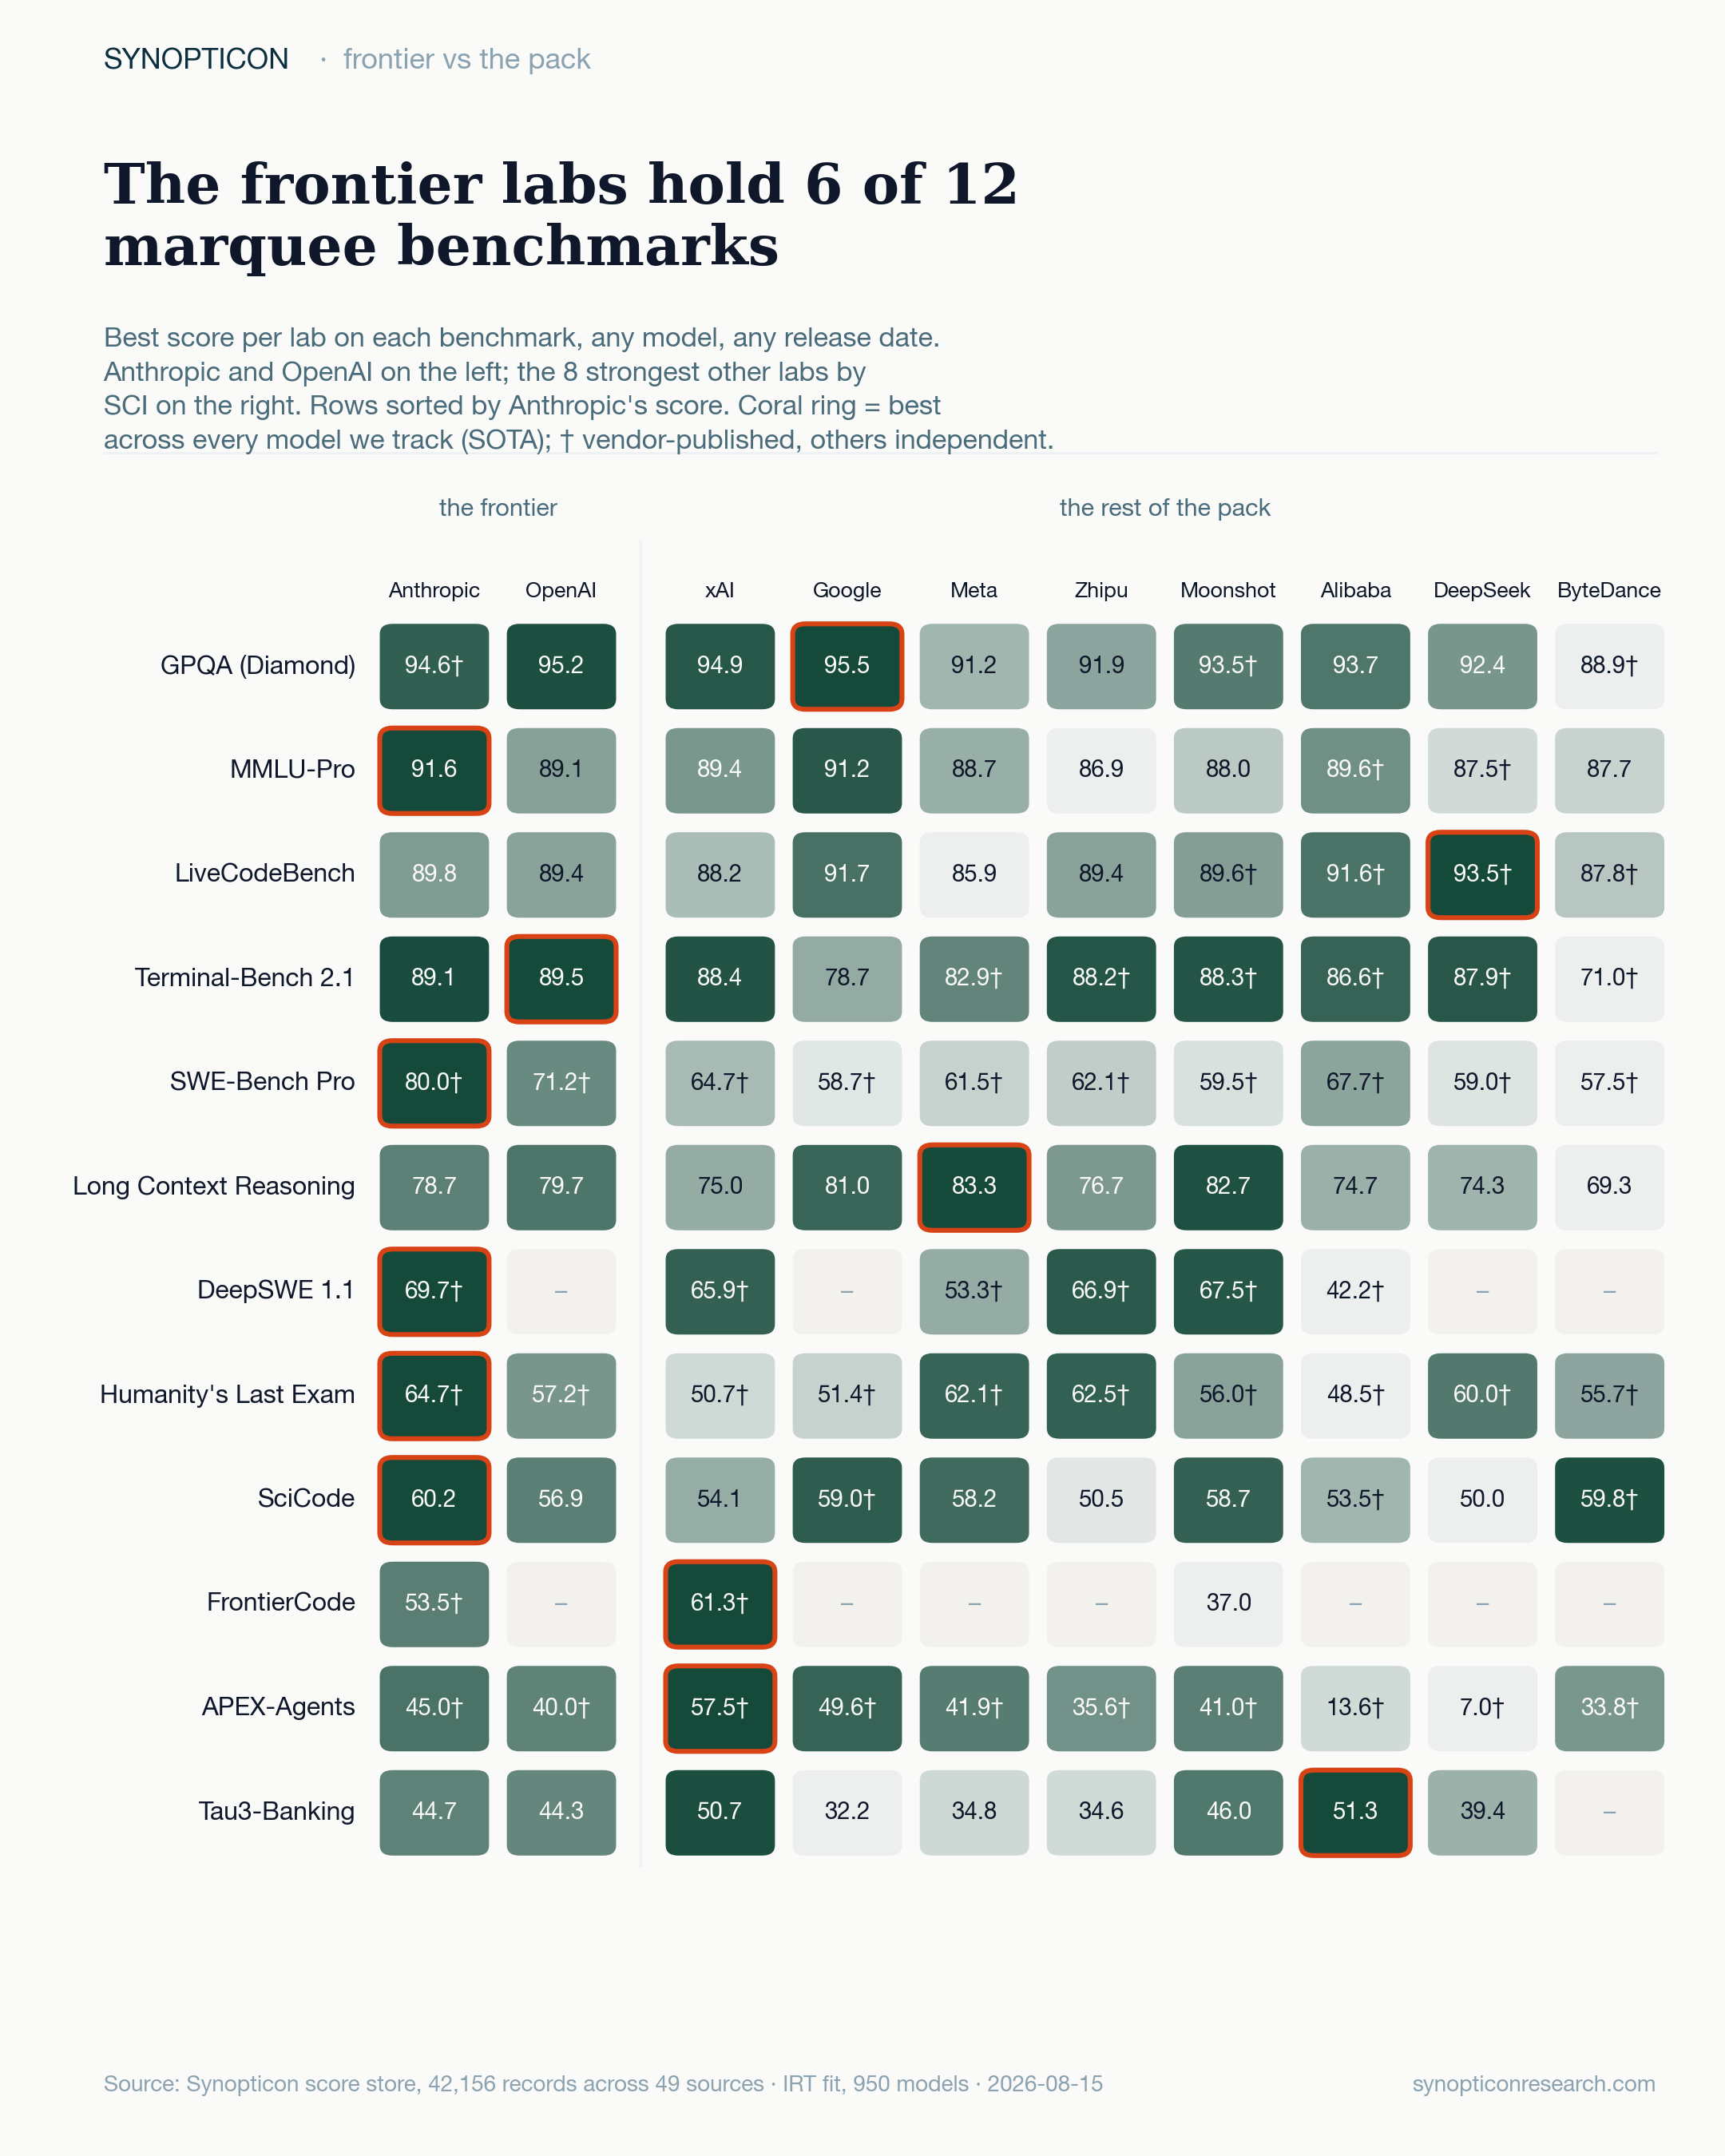
Mostly, yes. Rings (best score of any model we track) split six and six. GPQA belongs to Gemini 3.1 Pro at 95.5, LiveCodeBench to DeepSeek at 93.5 (vendor number), Long Context Reasoning to Muse Spark 1.2, FrontierCode and APEX-Agents to Grok 4.6 (vendor numbers), Tau3-Banking to Qwen3.8 Max. The frontier labs keep MMLU-Pro and Terminal-Bench by a hair, and the four hardest code and science rows outright: SWE-Bench Pro, DeepSWE 1.1, Humanity's Last Exam, SciCode. Read the right side of the table top to bottom and the cells fade from dark green to blank.
Next: turn the table into margins.
04
Who holds each benchmark, and by how much?
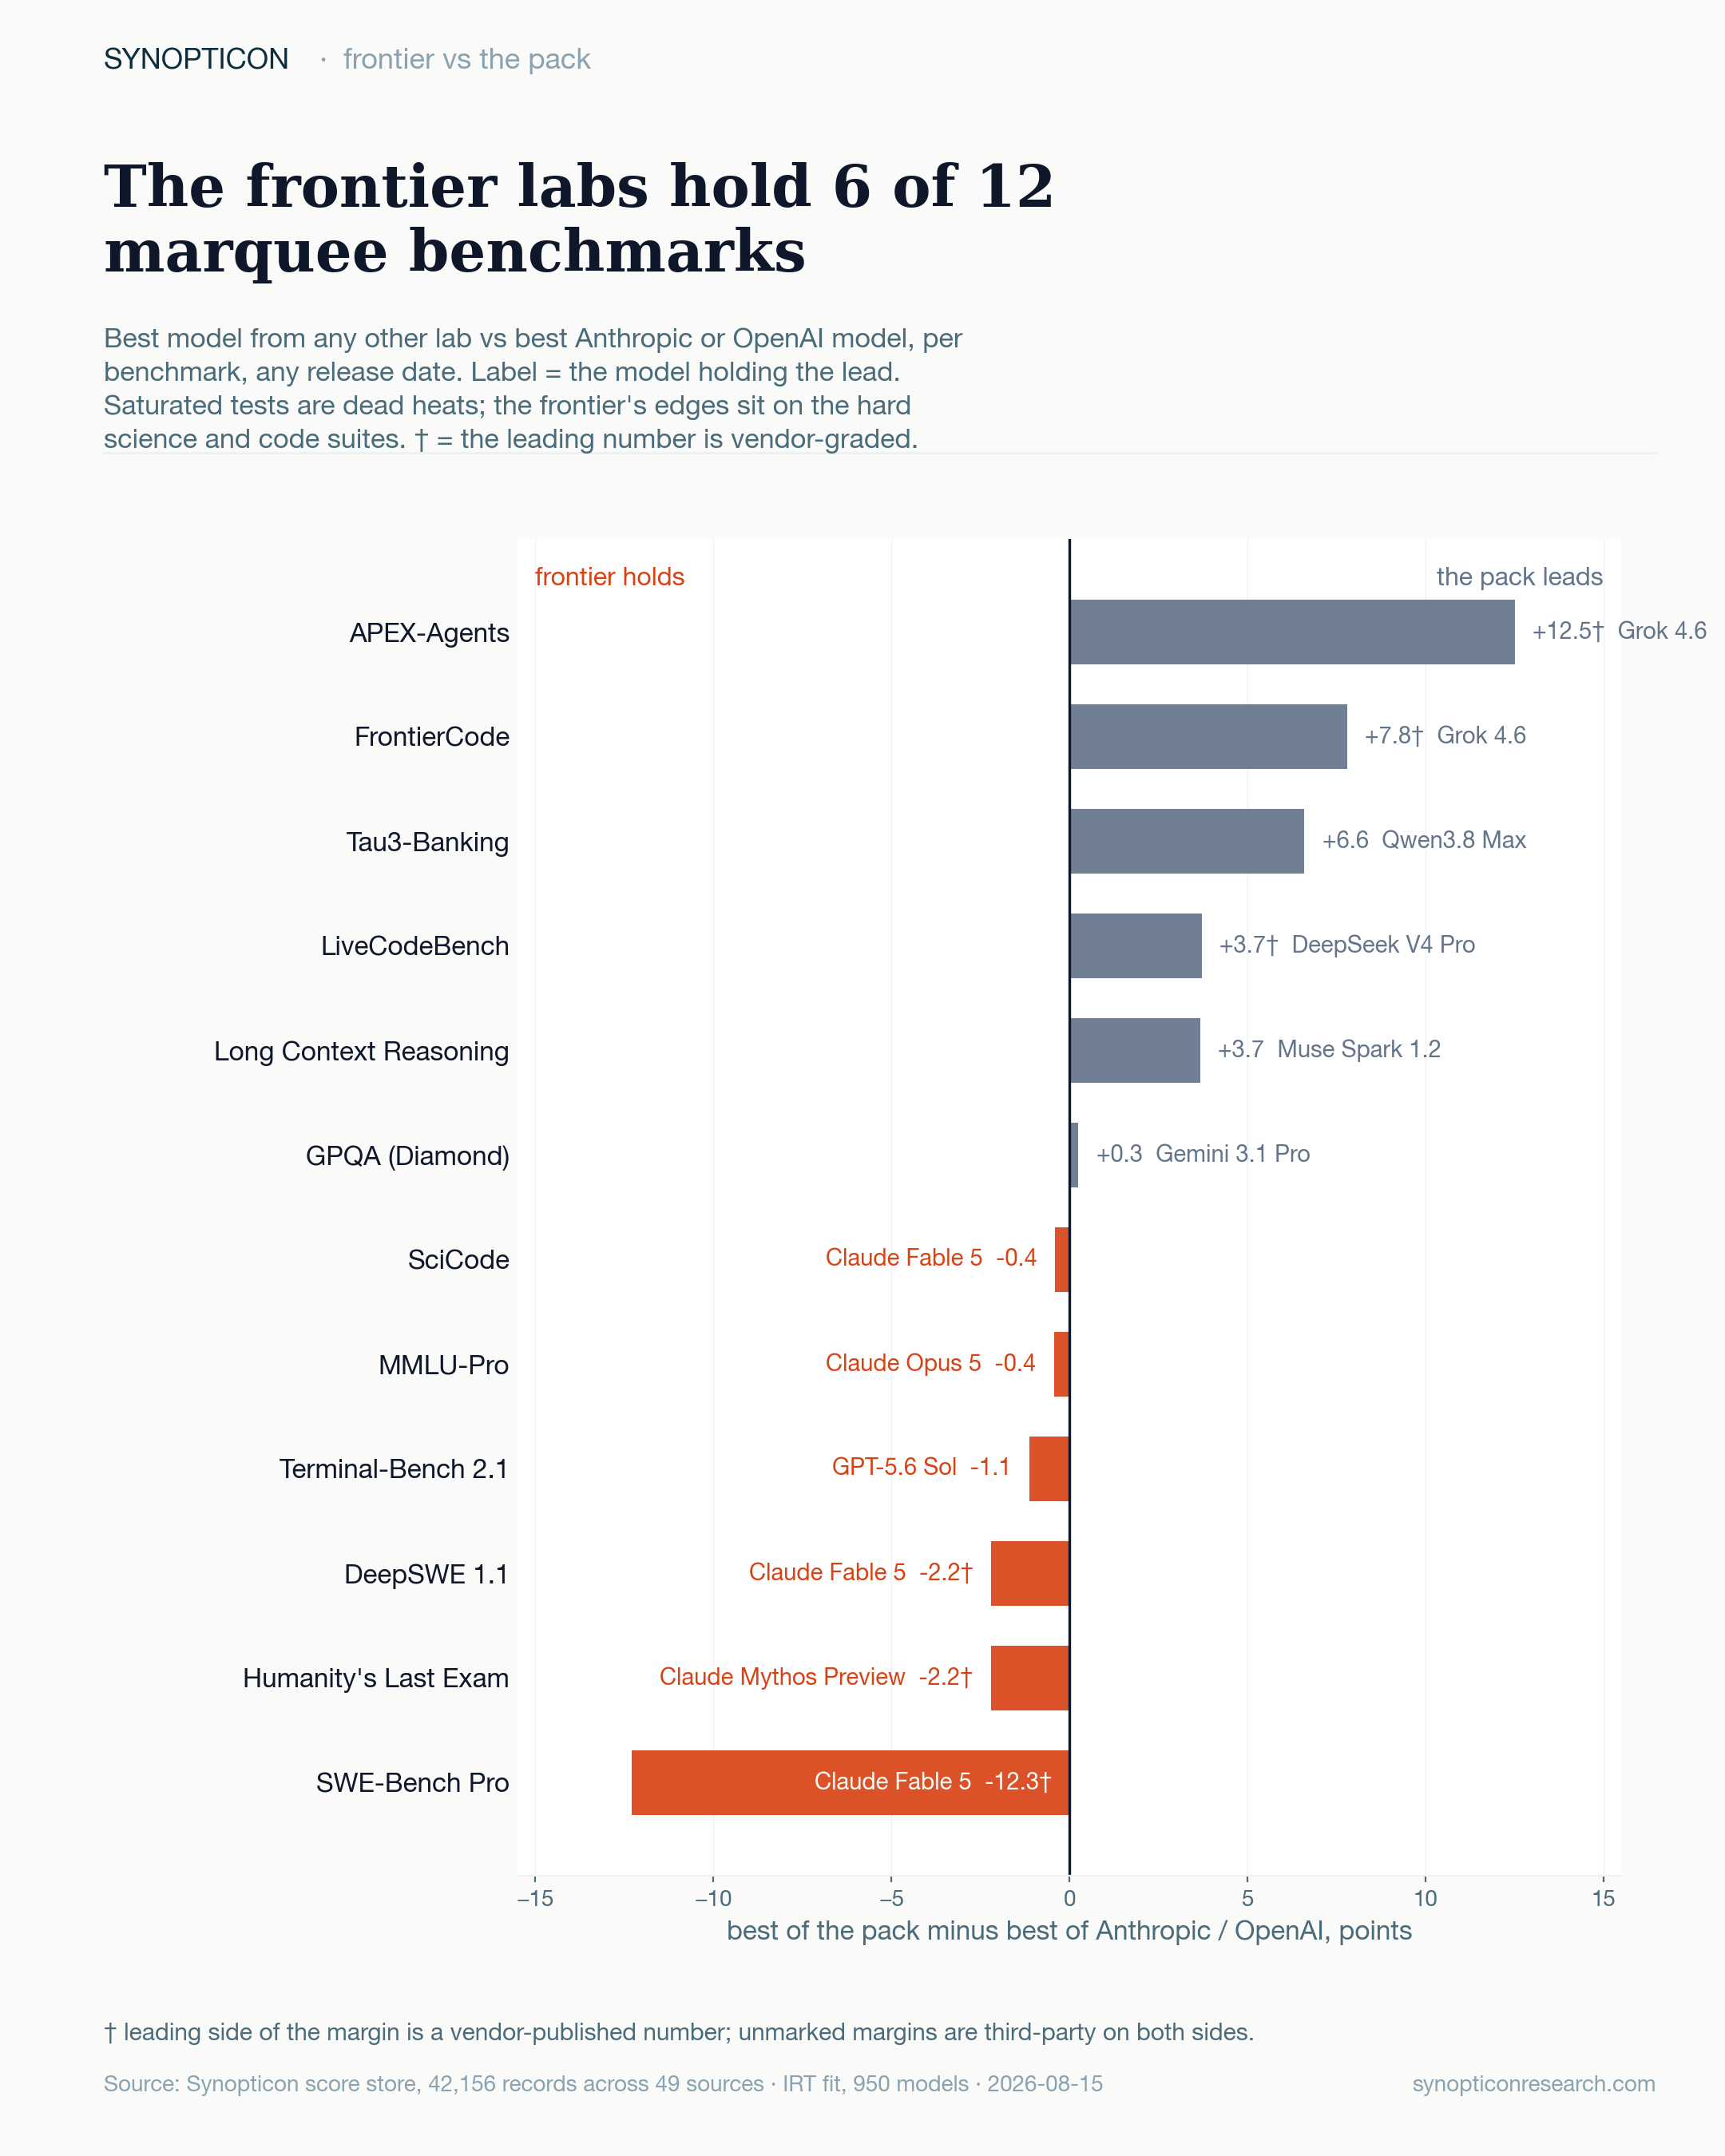
Six leads each, of unequal quality. Three of the pack's six rest on the vendor's own launch table (APEX-Agents, FrontierCode, LiveCodeBench); GPQA is a 0.3-point coin flip. Strip those out and the pack's clean, independent leads are Tau3-Banking (+6.6) and Long Context Reasoning (+3.7). The frontier's biggest edge is SWE-Bench Pro at 12.3 points, also vendor-graded on the leading side.
Next: 12 benchmarks is a curated list. Does the pattern hold across everything we track?
05
Does the pattern hold across all 334 shared benchmarks?
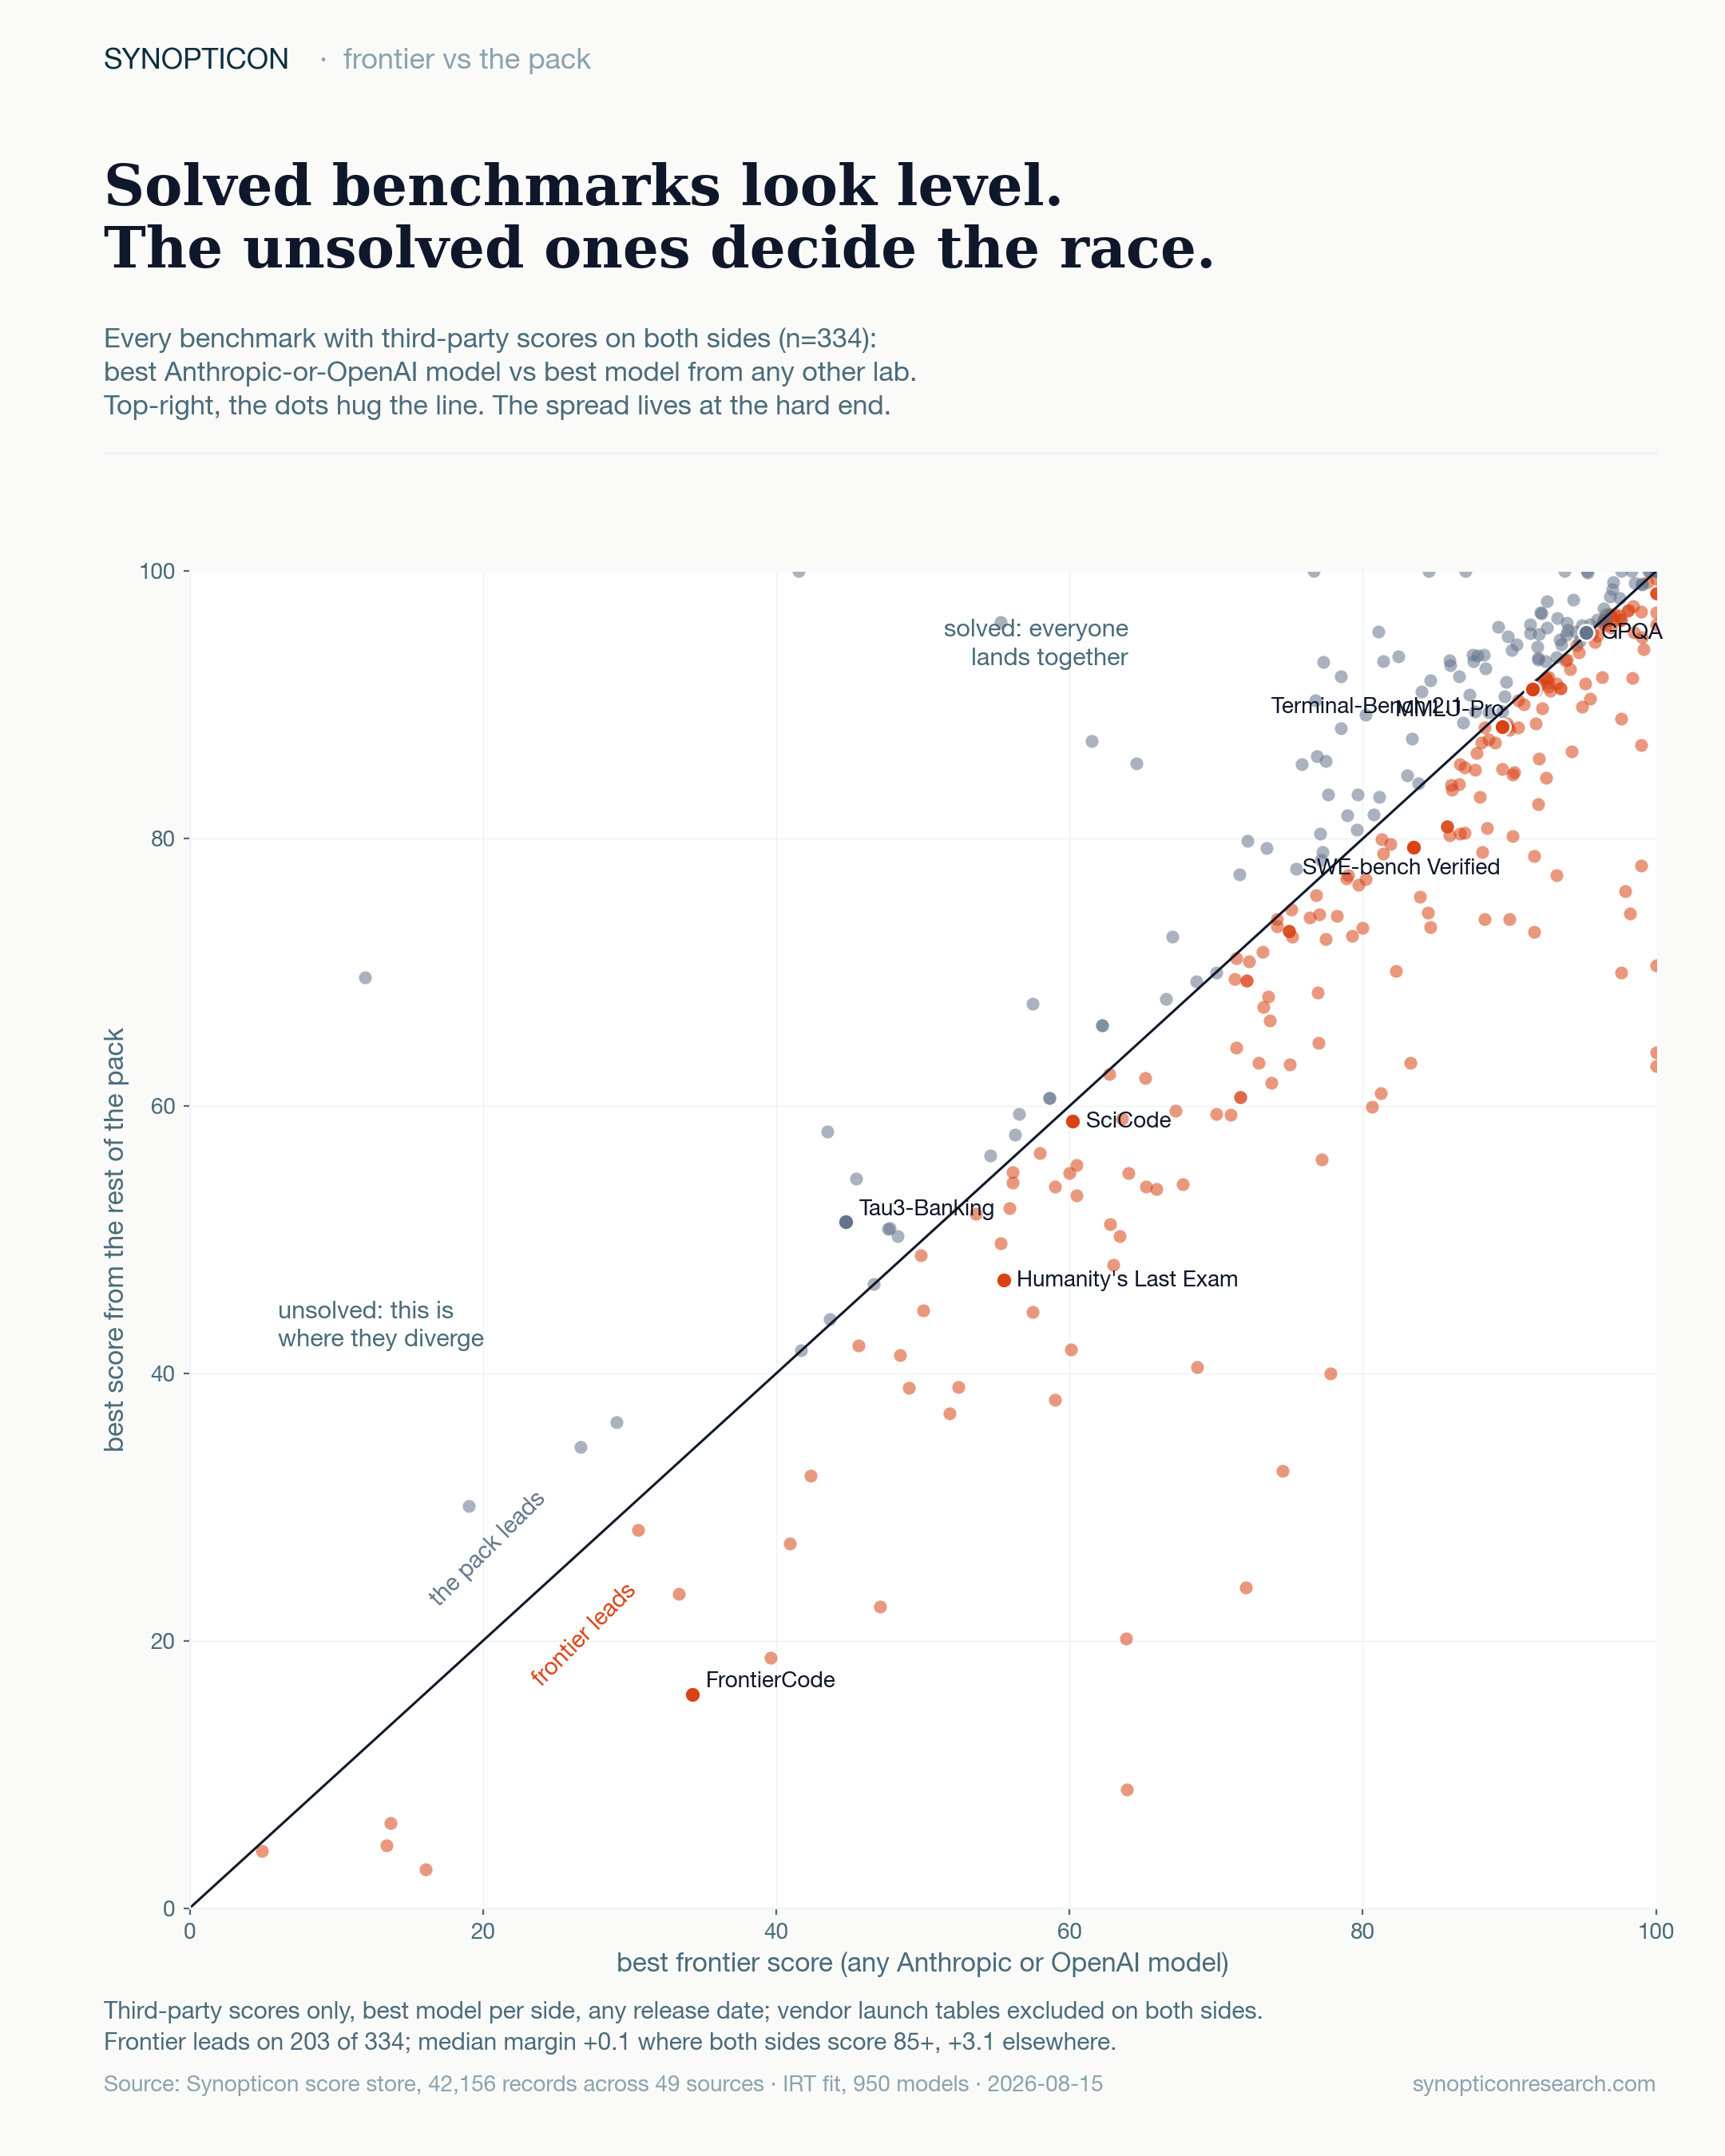
Yes. Third-party scores only, 334 benchmarks. Where both sides score 85 or better (146 benchmarks) the median margin is 0.1 points and the wins split 75 to 57: everyone lands together. Everywhere else (188 benchmarks) the median frontier margin is 3.1 points and the frontier labs lead 128 to 57. Solved benchmarks look level because a solved benchmark cannot separate anyone.
Next: "solved" is a vibe. Put difficulty on the x-axis.
06
Does the gap track benchmark difficulty?
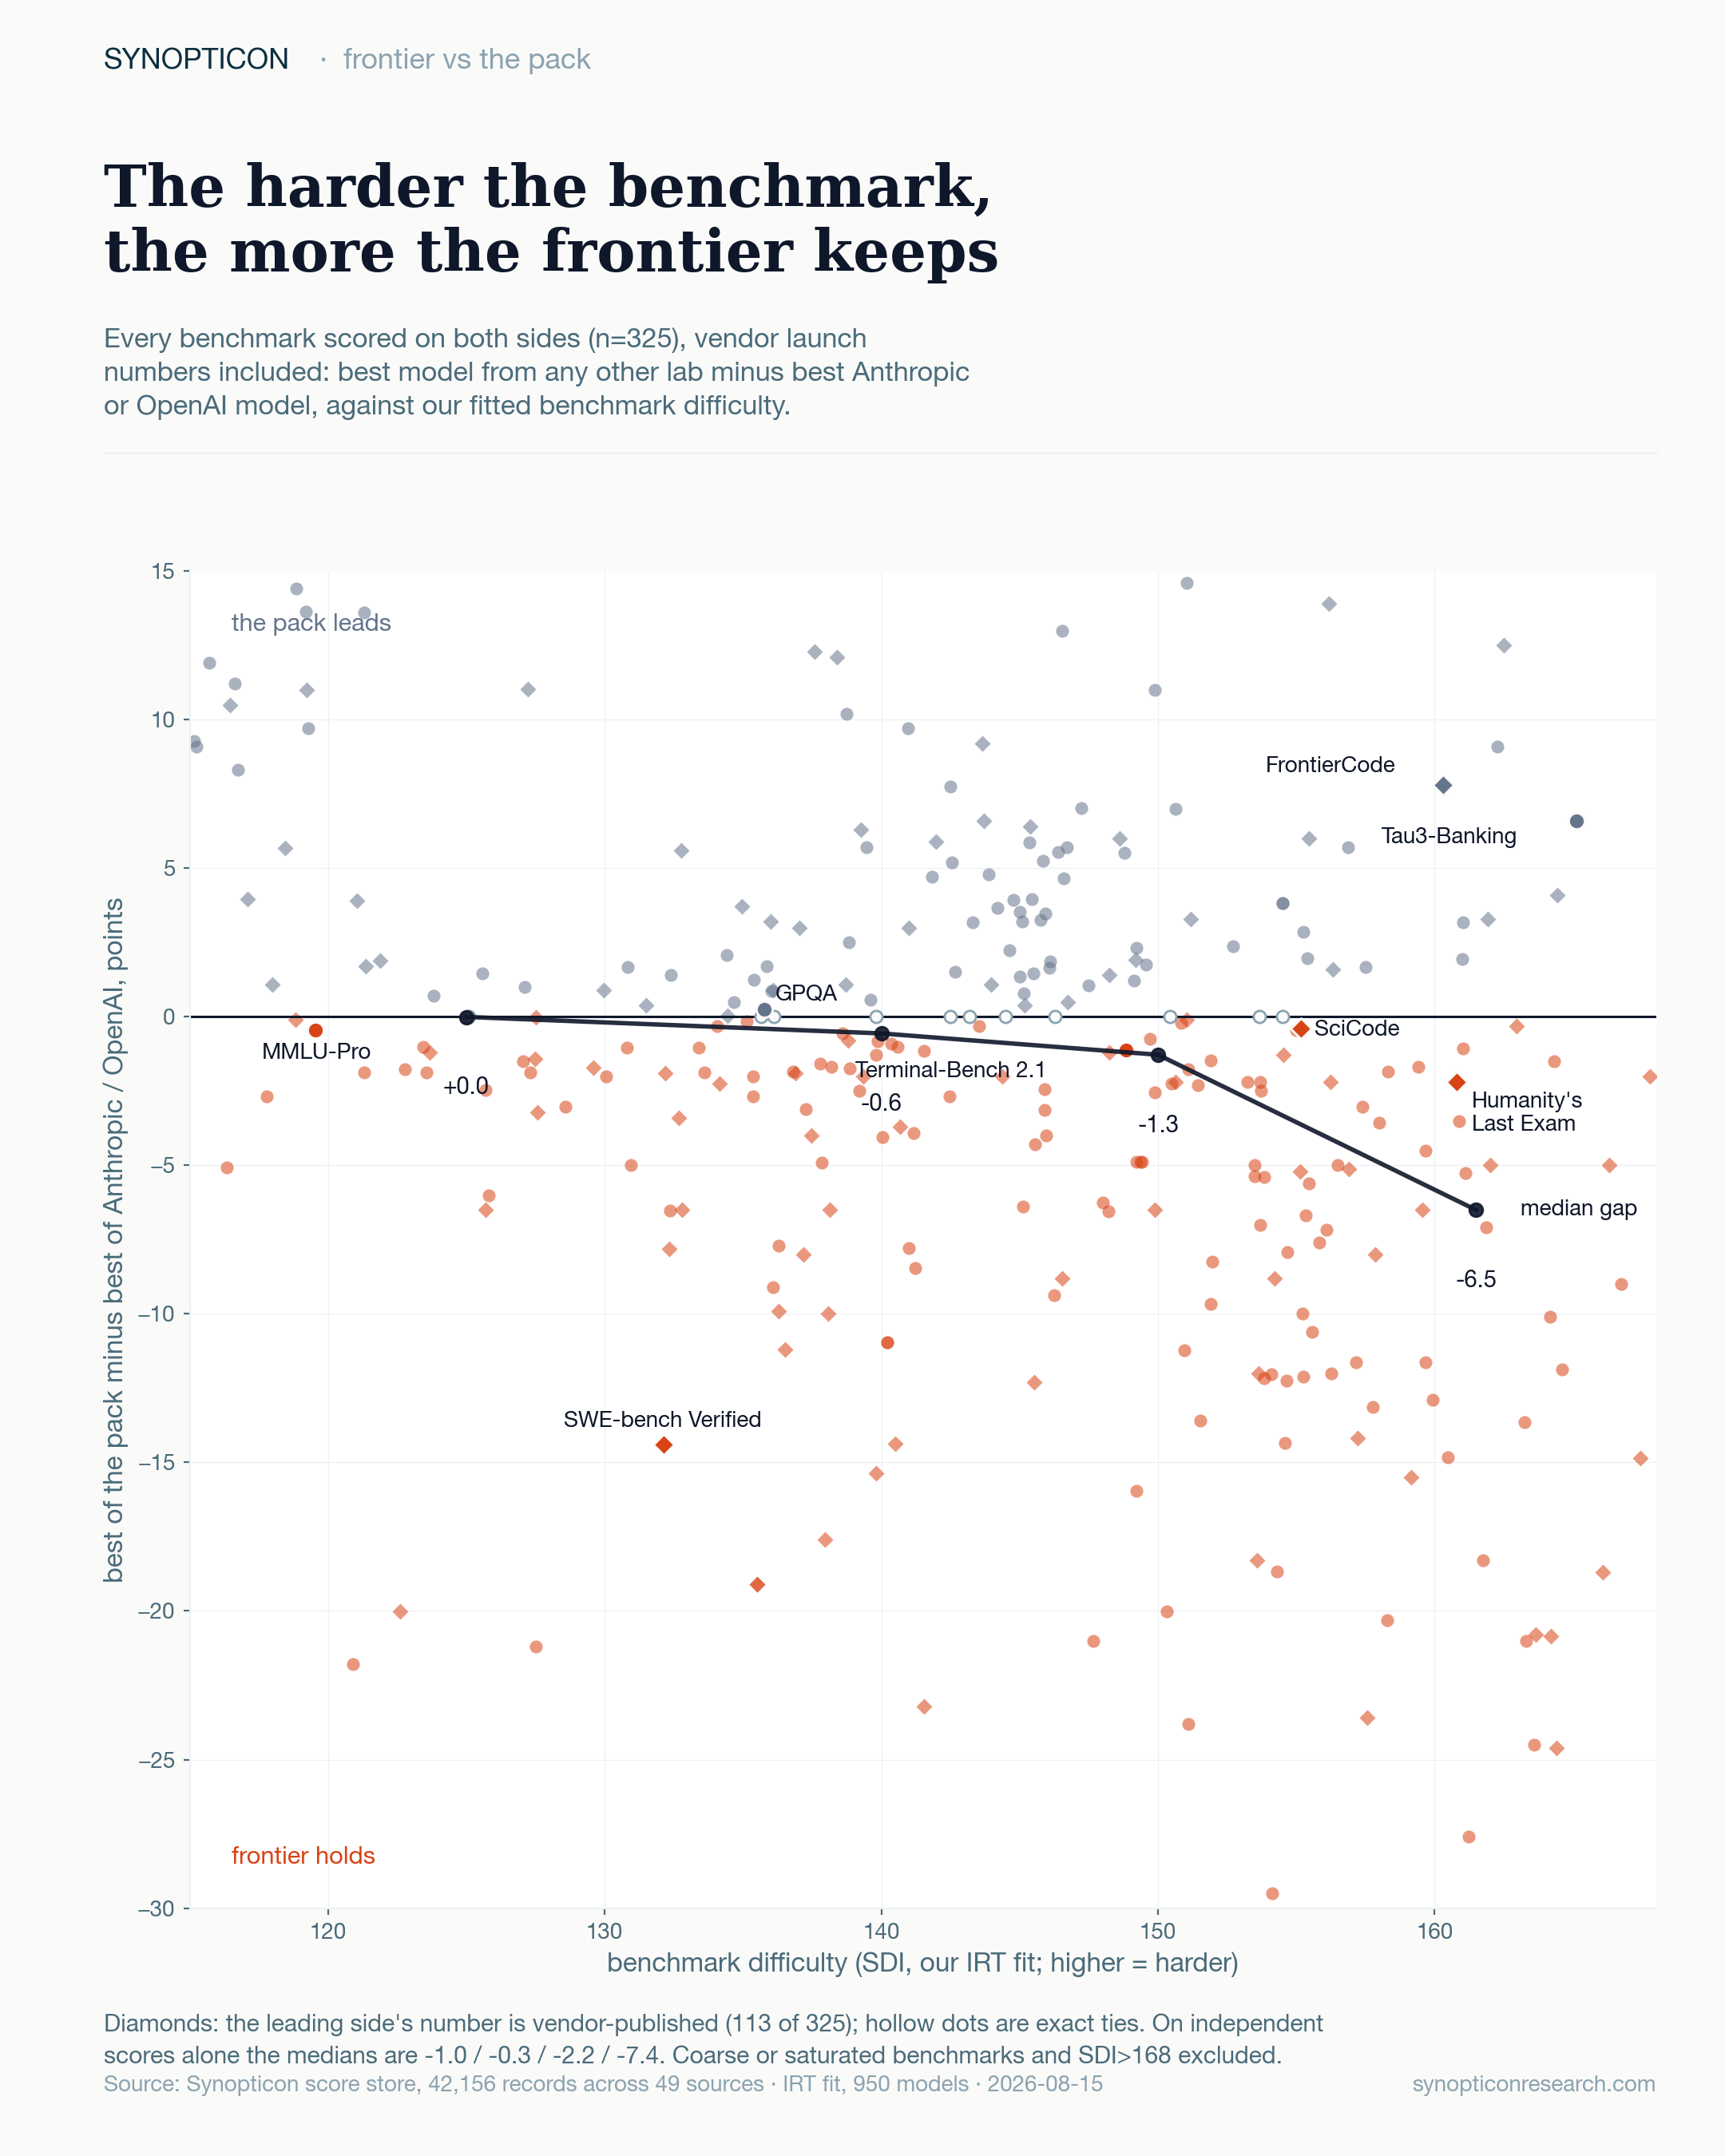
It does. Our fitted difficulty index (SDI, from the same IRT model that produces SCI) runs left to right. The median pack deficit is 0.0 points around SDI 125, 0.6 near 140, 1.3 near 150 and 6.5 near 161. This chart includes every lab's own launch numbers, which flatter both sides; on independent scores alone the medians are 1.0, 0.3, 2.2 and 7.4. The lead sits at the top of the difficulty scale, and almost nowhere else.
Next: margins on shared benchmarks are one lens. Wins and losses are another.
07
Head to head, who wins?
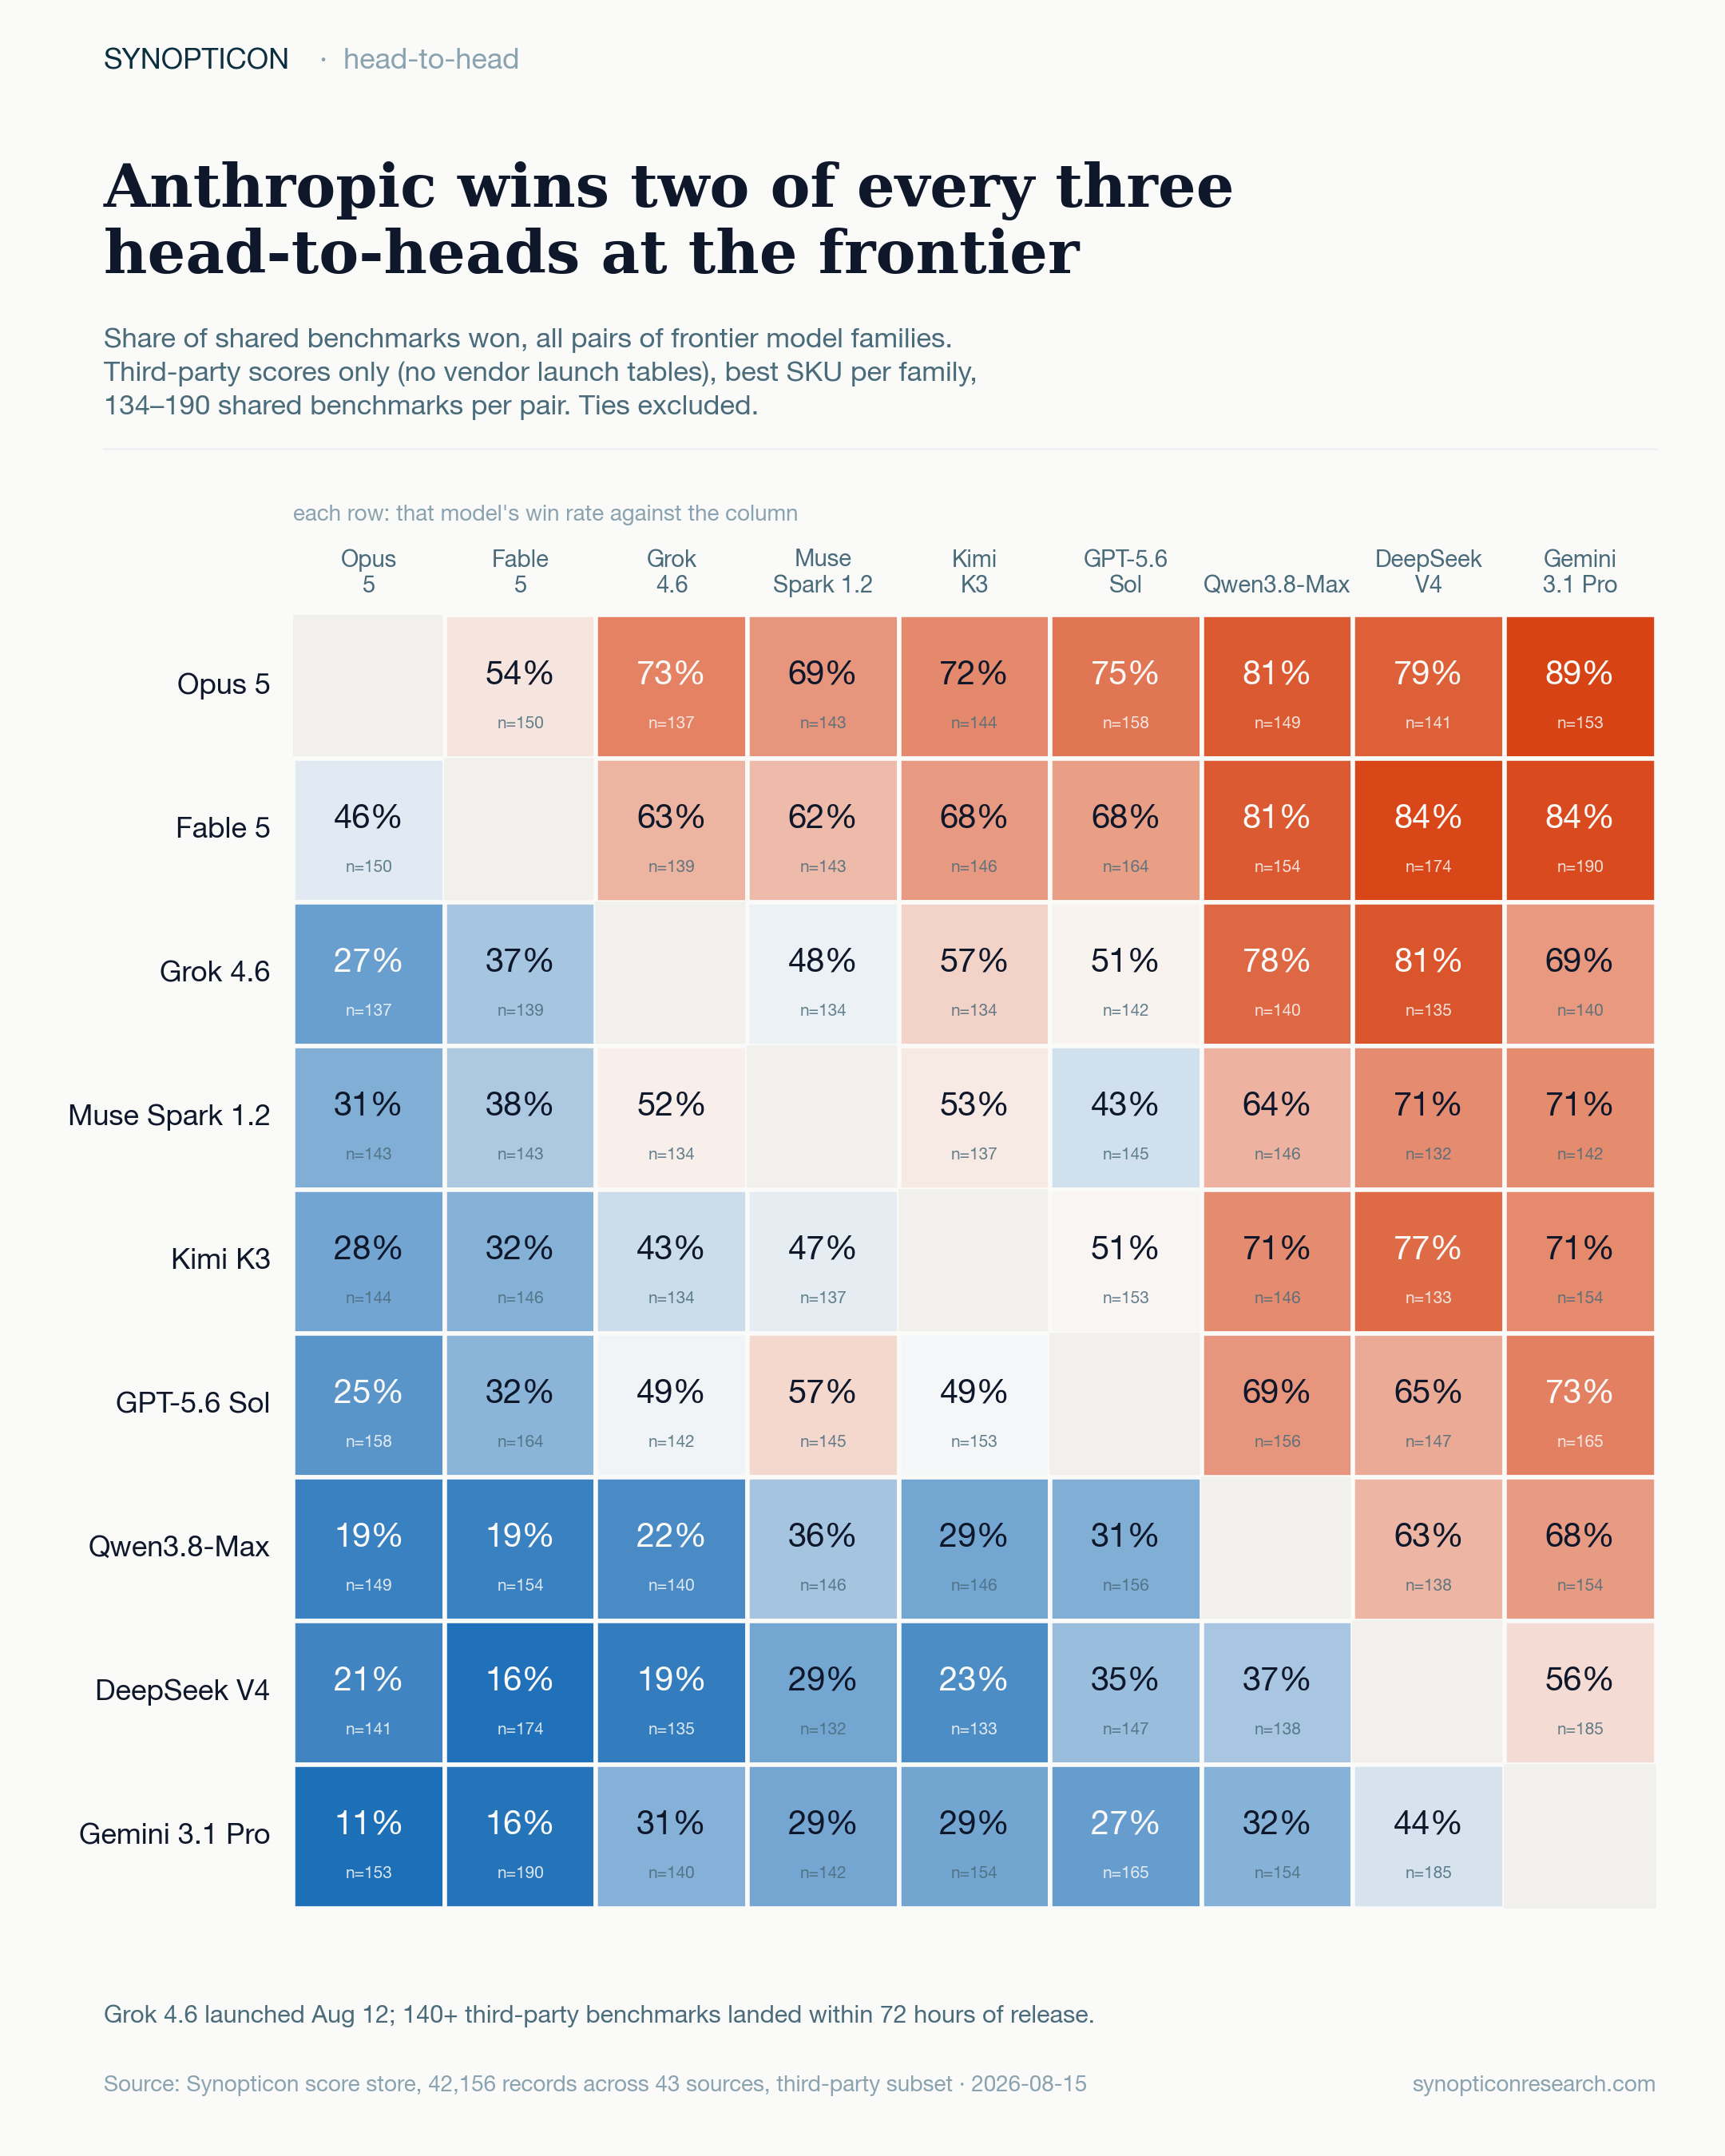
Anthropic wins two of every three. Opus 5 takes 73% of shared benchmarks against Grok 4.6, 75% against GPT-5.6 Sol, 89% against Gemini 3.1 Pro; Fable 5 runs 63% / 68% / 84% on the same columns. Grok 4.6 against GPT-5.6 Sol is a coin flip at 51% (n=142). Below that line the order is clean: Grok beats Qwen3.8-Max 78%, DeepSeek V4 81%, Gemini 69%. On win rate, the frontier is Anthropic first, then a tie between OpenAI and xAI.
Next: everything above collapses many benchmarks into one number. How?
08
How does SCI turn 150 scores into one number?
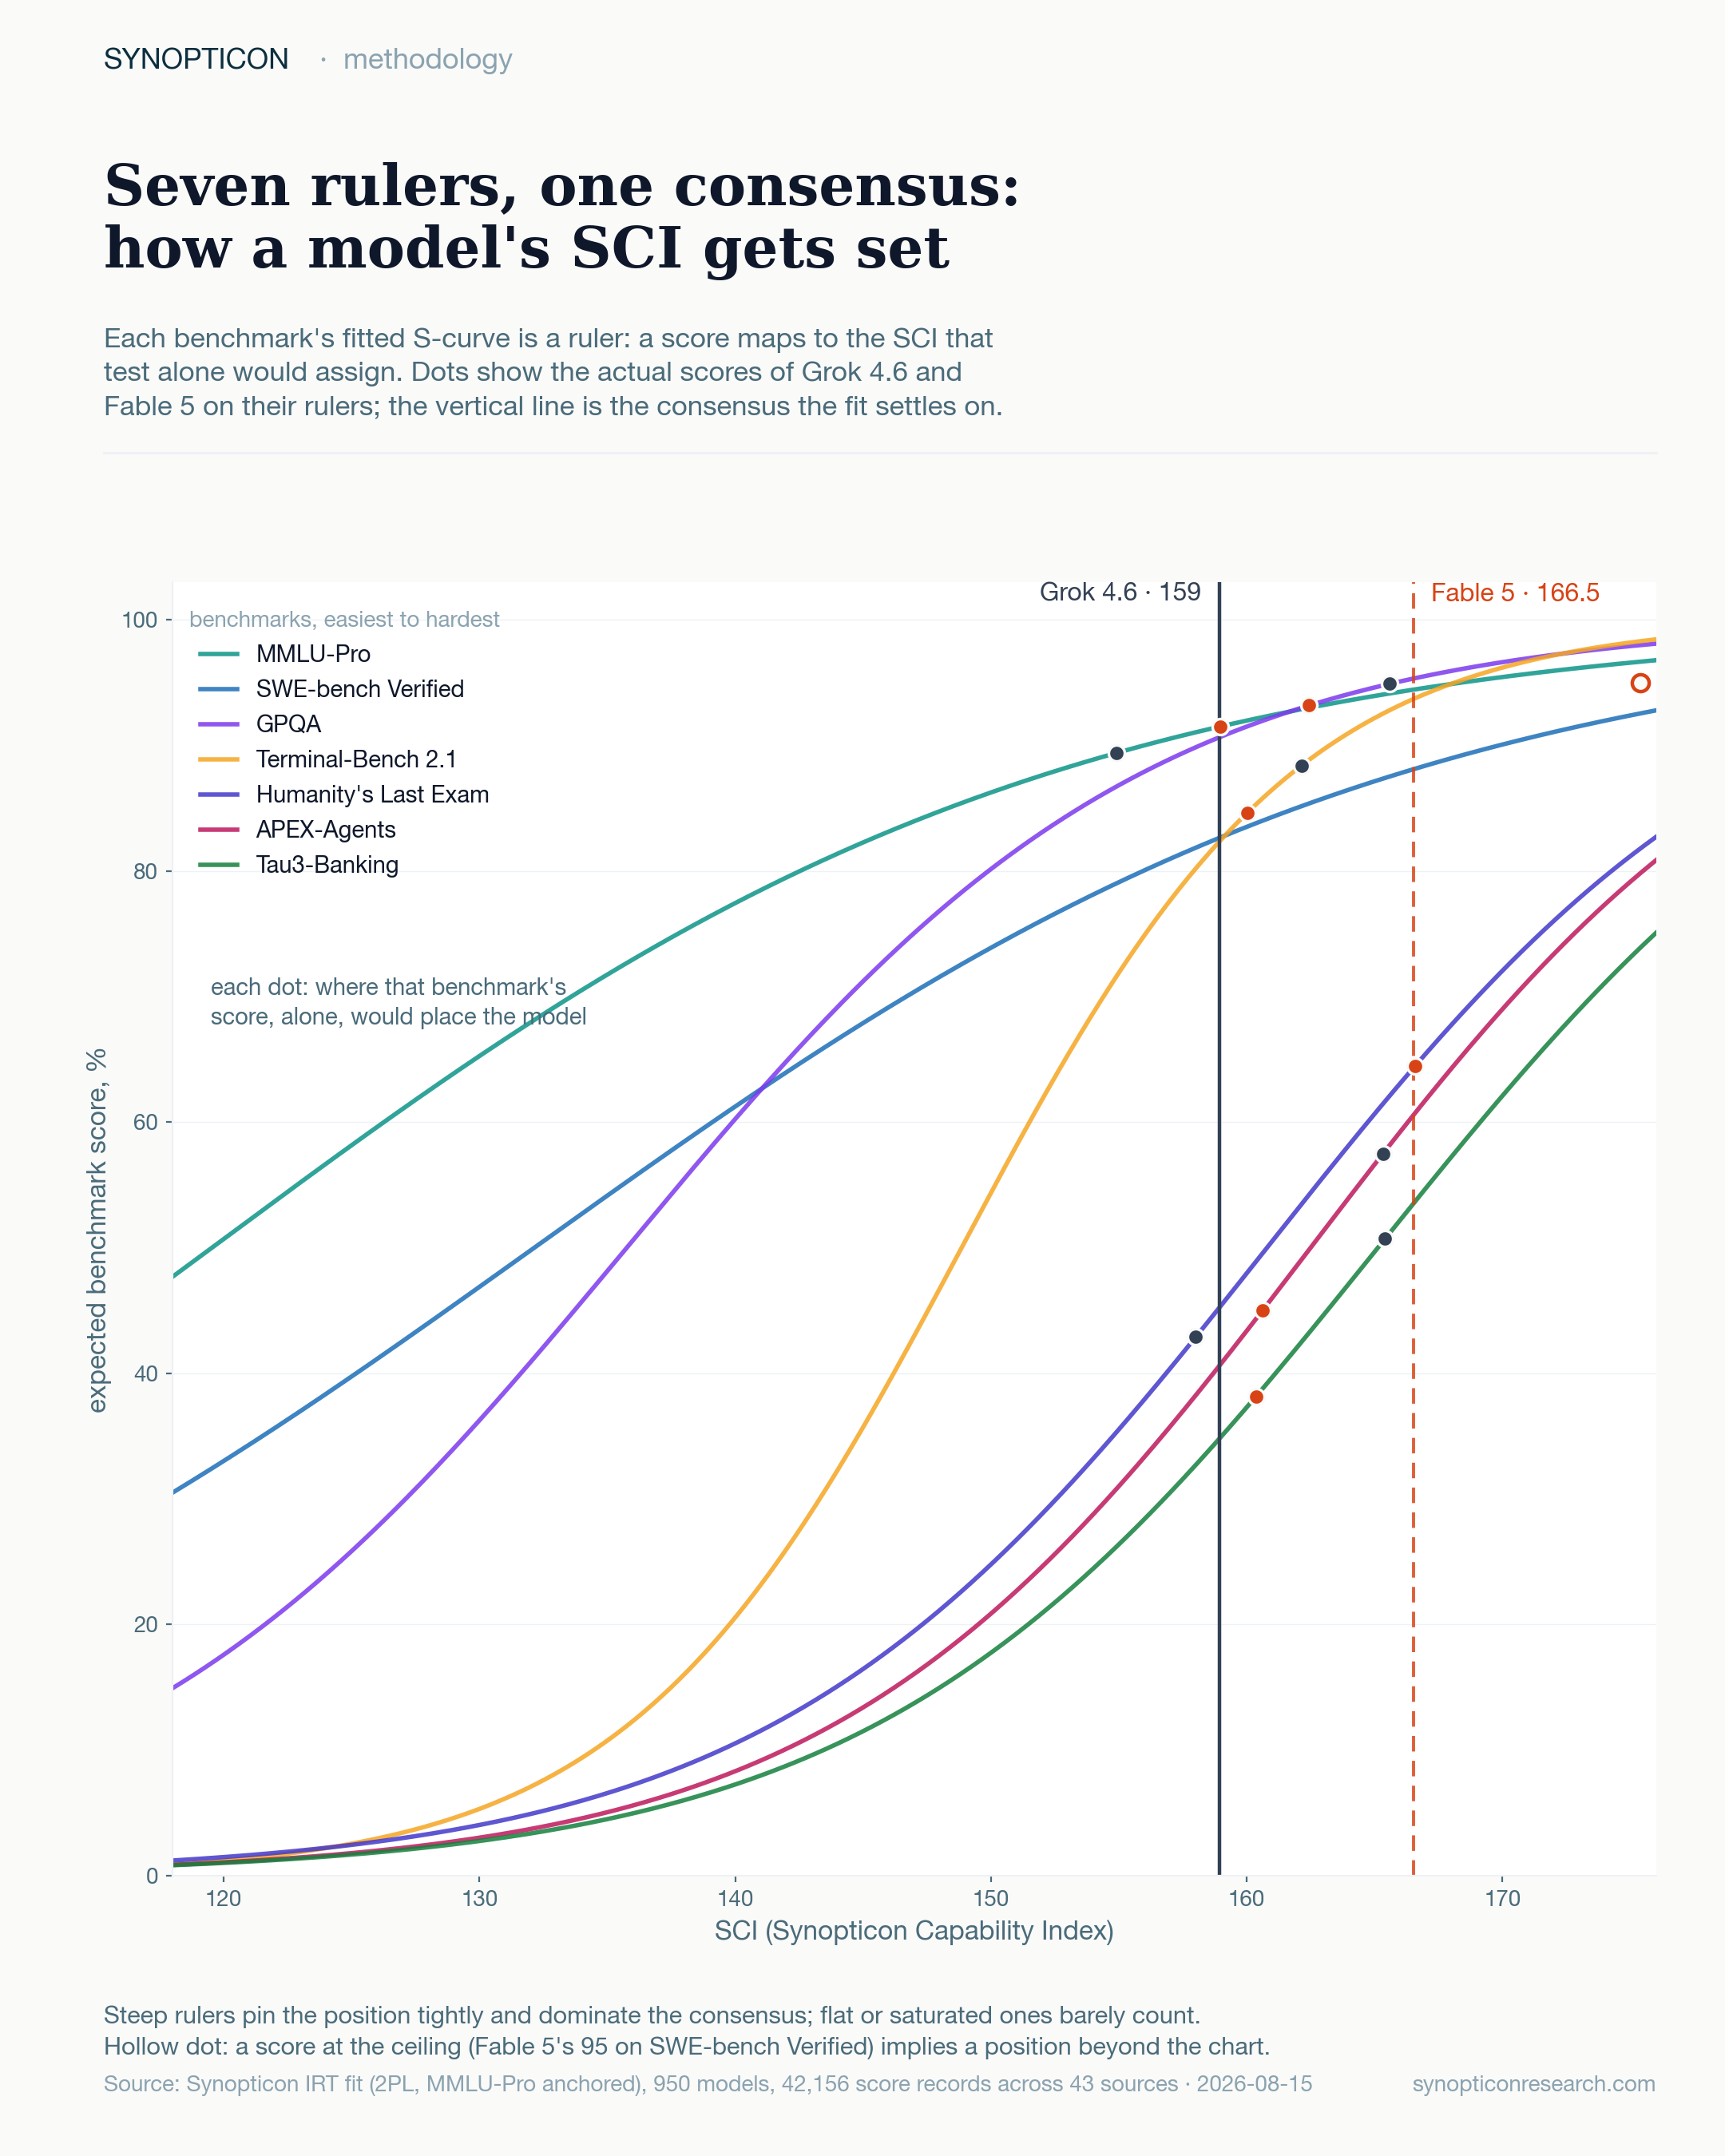
Every benchmark gets a fitted S-curve: the score a model of a given SCI should expect. Each curve is a ruler; a model's score maps back to the SCI that test alone would assign. Grok 4.6's dots scatter from about 155 (MMLU-Pro) to 165 (Tau3-Banking); the fit settles on 159, the one position that best explains all of them at once. Steep curves (Terminal-Bench 2.1 in this range) pin a model tightly and dominate the consensus. Flat or saturated ones barely count. That is why a half-point on GPQA and a seven-point gap on SWE-Bench Pro do not cancel: the fit weights the test that can still tell models apart.
What to watch
The pack's best models are within four points of each other and within three of OpenAI's best. The gap that decides the ranking is on SDI-150+ benchmarks: SWE-Bench Pro, SciCode, DeepSWE, HLE. A pack model that closes those by more than three points reorders the ladder. One that closes GPQA by another half point changes nothing. Chart 6 redraws against the daily fit on the leaderboard; the median in its hardest band is the number to check, and chart 1's wake will show which way it is moving.
Method, briefly
Scores come from the Synopticon score store: 42,156 records across 49 sources as of 2026-08-15, covering 950 fitted models. "Frontier" is every Anthropic or OpenAI model; "the pack" is every model from every other lab; each side is its best score per benchmark, any model, any configuration, any release date. Charts 1, 2, 6 and 8 use the SCI/SDI fit: a two-parameter IRT model, anchored to MMLU-Pro, that jointly estimates model capability and benchmark difficulty. Charts 1, 5 and 7 use third-party scores only. Charts 3, 4 and 6 include vendor-published launch numbers, marked with a dagger or diamond; the vendor-free medians are given in the text where they differ. Chart 7 compares named model families rather than labs. Chart 1 dates each score by its model's release date (score date as fallback) and holds SDI at the current fit. All 950 models update daily at synopticonresearch.com/leaderboard. Chart scripts live in intelligence/scores/scripts/viz_pack_*.py (copies in articles/frontier-vs-pack/scripts/).